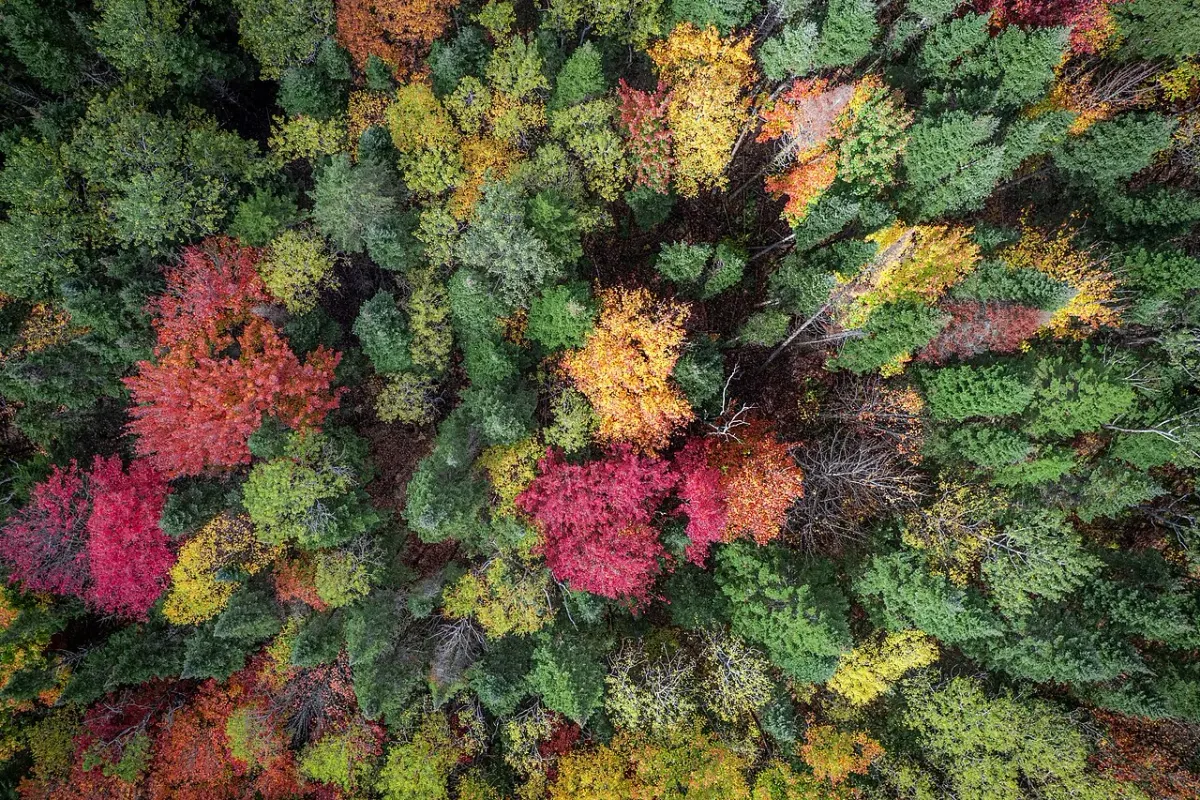
Google DeepMind and Google Research released ForTy on October 22, a global map that separates natural forest, planted forest and tree-based farming at 10-meter resolution. It provides a 2020 baseline and an early annual series for 2017 through 2025.
The World Resources Institute and IIASA worked on the release. The map is available in a public Earth Engine viewer.
The research announcement describes a model that uses satellite-derived information, including AlphaEarth Foundations embeddings, to classify land.
Forest types in the map
| Group | What the map distinguishes |
|---|---|
| Natural forest | Primary and naturally regenerating forest |
| Human-planted forest | Planted and plantation forest |
| Farming and remaining land | Tree crops/agroforestry and other land |
The categories help explain why an area can lose natural forest and later look green again as a plantation. A tree-cover layer alone may leave that change difficult to interpret.
A 10-by-10-meter cell covers 100 square meters, about 1,076 square feet. That is an area calculation from the stated resolution, not a promise that every object within it is identifiable. A small property or a narrow strip beside a road can occupy only part of a cell. Boundary errors therefore matter more when the question concerns one plot than when it concerns a broad region.
The UN Food and Agriculture Organization's 2020 assessment definitions also distinguish forest from tree-covered land used predominantly for agriculture or urban purposes. That provides context for the category split: a map of green canopy and a map of forest land use can answer different questions about the same place. Comparisons between datasets depend on how each defines forest.
Google's system provides class probabilities, and its announcement describes validation against sampled sites. Individual property classifications remain uncertain even where the regional pattern is clear.