U.S. producers received 6.5% more for their goods and services in October than a year earlier, the Bureau of Labor Statistics reported Friday. That was the largest 12-month increase since November 2022. From September to October, however, the Producer Price Index rose 0.3%, well below September’s revised 1.4% increase.
The two figures describe different stretches of time. October’s monthly reading measures the latest change, after adjusting for seasonal patterns. The annual reading also includes the previous 11 months and compares the current index with its level last October. That can leave the annual increase rising while the monthly pace eases. A slower increase still means producers received more overall than they did the month before.
What pushed producer prices higher
Prices for goods sold for final demand rose 0.5% in October, down from 2.5% in September. Food prices rose 1.3%, while energy prices edged down 0.1% after rising 10% in September. Goods excluding food and energy rose 0.5% and accounted for more than 60% of the overall increase in goods prices. Within energy, diesel fell 7.9%, even as jet fuel and gas fuels rose. One fuel price alone gives a limited picture of what manufacturers and other businesses received.
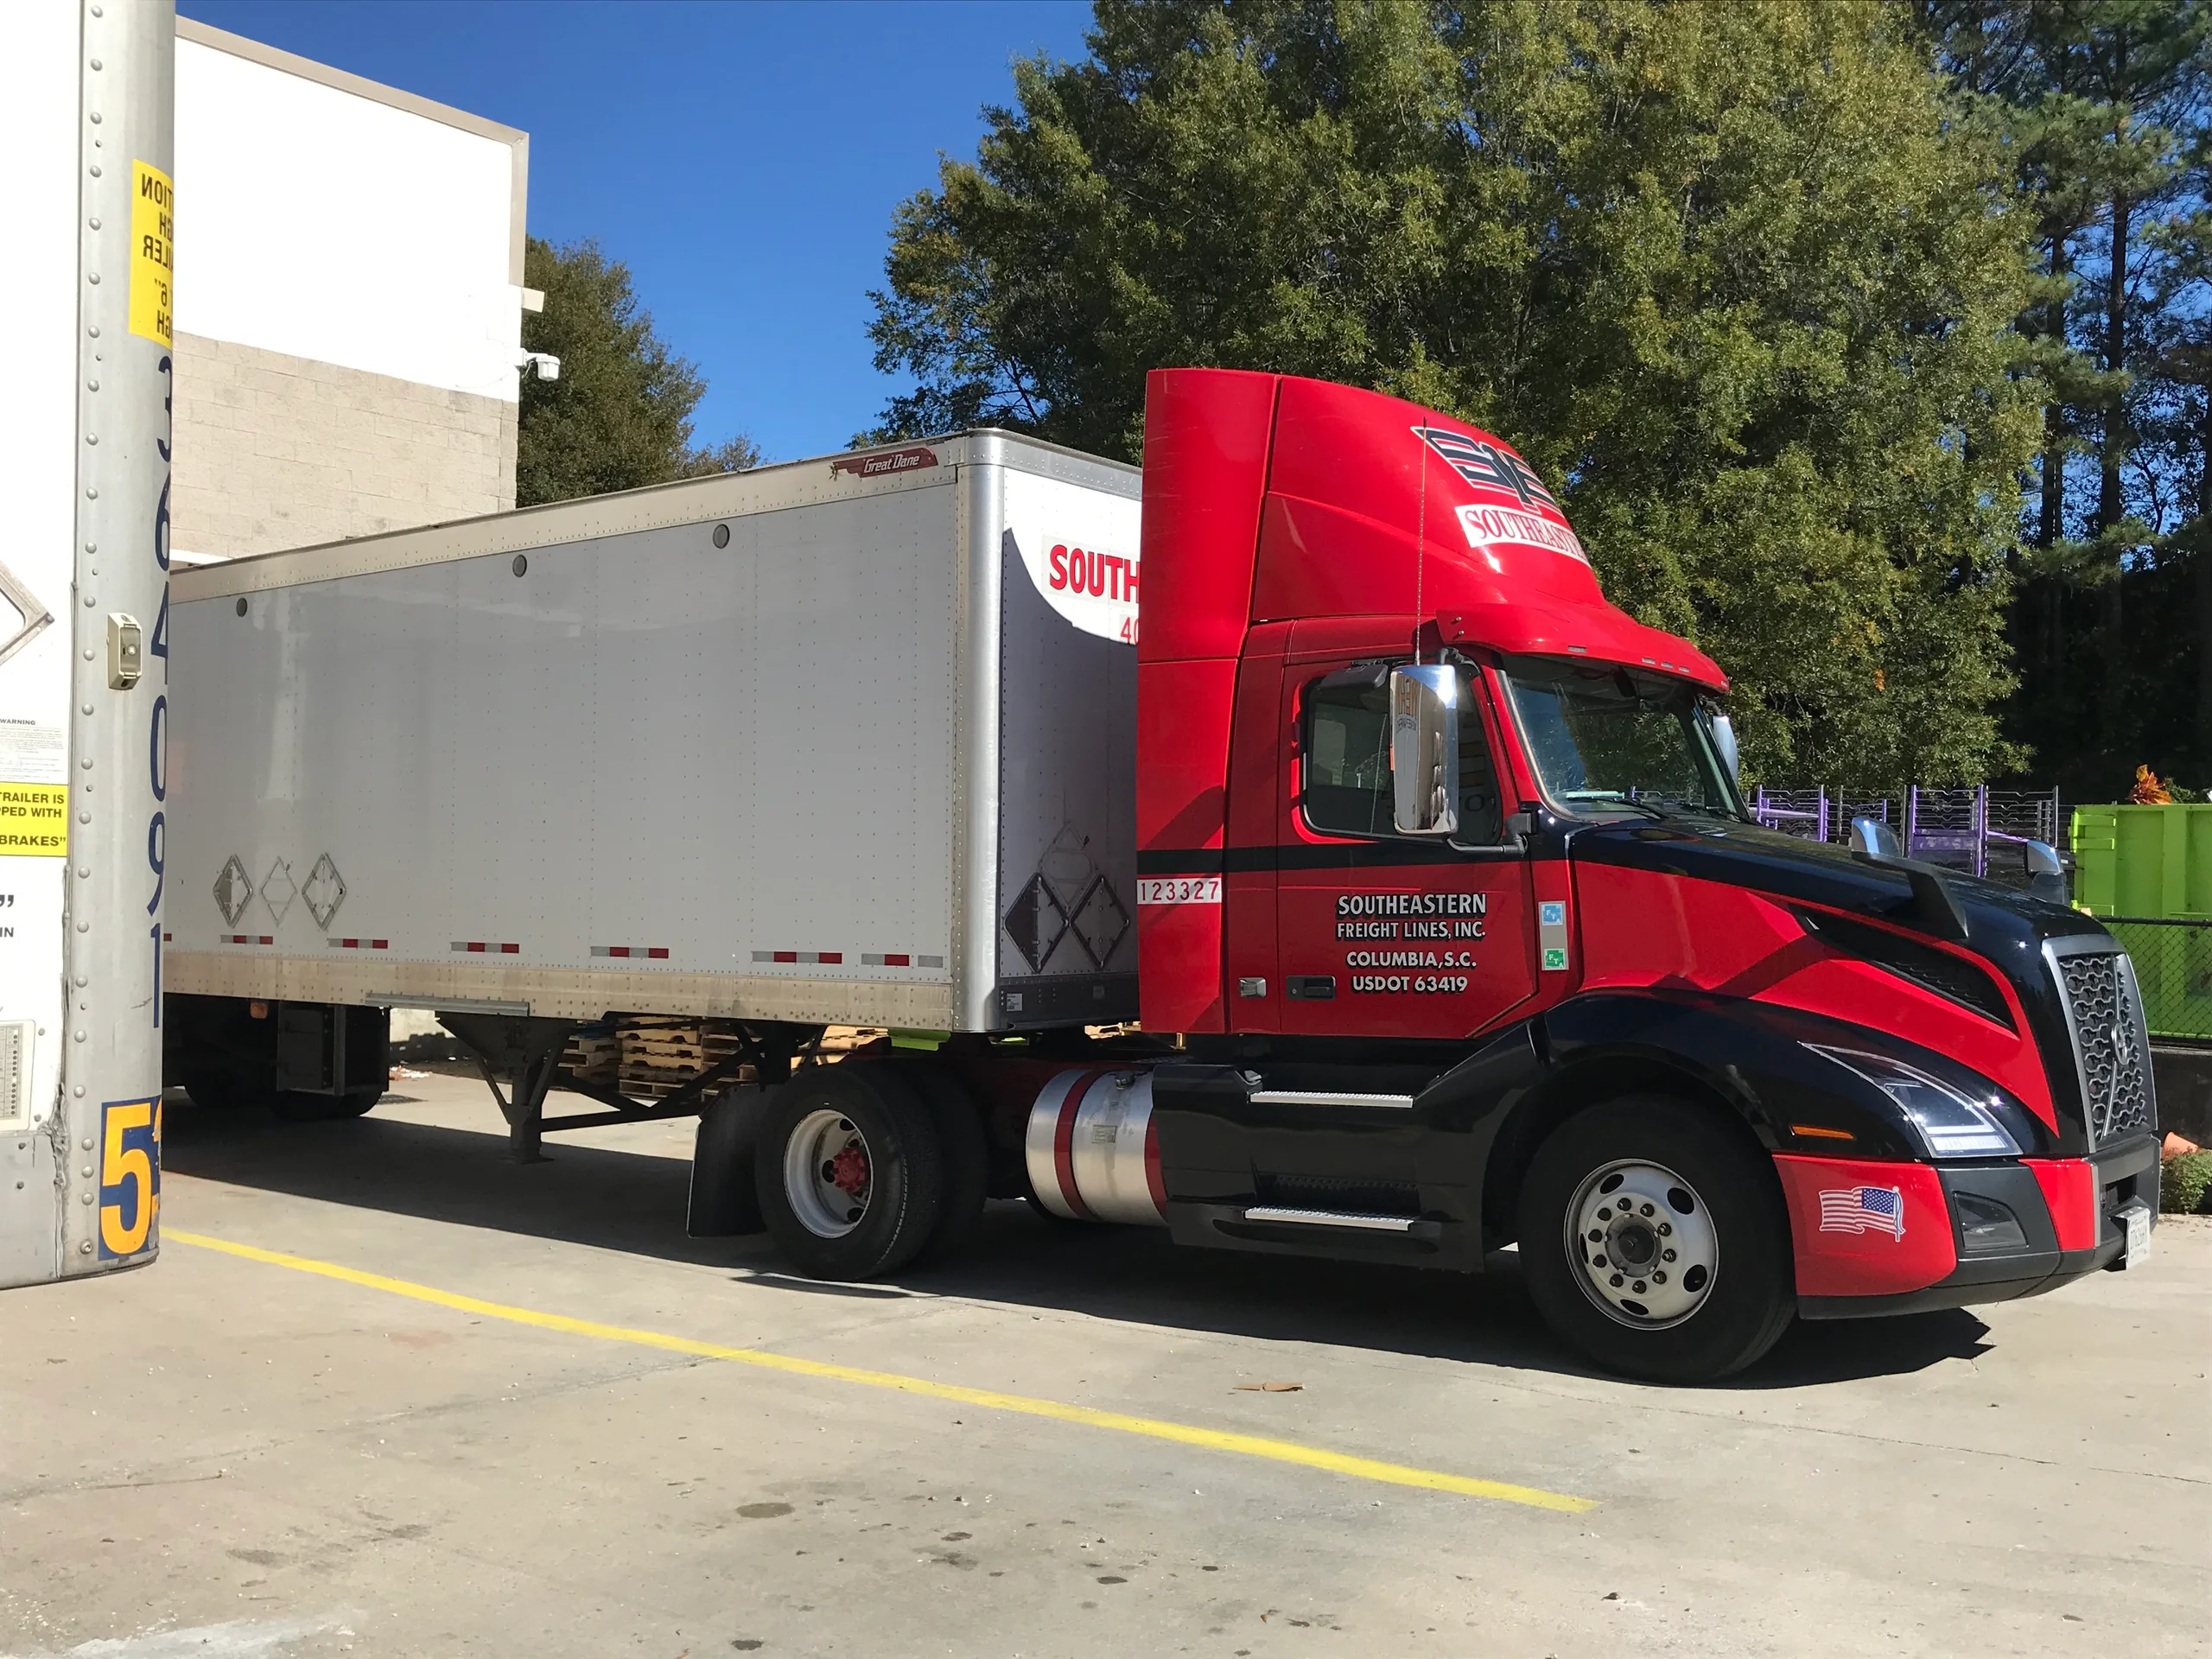
Prices for services rose 0.2% for the fifth straight monthly increase. Transportation and warehousing prices rose 2.0% and accounted for about three quarters of the increase in services. Truck freight prices alone rose 3.9%. That is the change in the price of trucking services measured by the index. It does not imply a 3.9% increase in the cost of every shipment, and it can move differently from the price of diesel fuel in the same month.
The index excluding food, energy and trade services rose 0.5%, the same pace as in September. Over 12 months it rose 4.9%. For trade services, the PPI measures what wholesalers and retailers keep after paying for the goods they resell. Margins for those services fell 0.2% in October.
September’s energy jump helps explain the monthly slowdown. Its 10% increase became a 0.1% decline in October, while the rise in goods prices excluding food and energy went from 0.3% to 0.5%. The smaller headline increase therefore came alongside a faster rise in that part of the goods index. The monthly changes are seasonally adjusted.
How the figures compare with what shoppers paid
The October Consumer Price Index, released Tuesday, rose 0.4% from September. That report measures prices paid by urban consumers. The PPI tracks the prices domestic producers receive and includes sales to businesses, governments and customers abroad. It excludes imports, which can be part of a consumer’s shopping basket. The two indexes also give different weights to the products and services they measure. Shelter accounted for more than 30% of October’s monthly rise in the CPI.
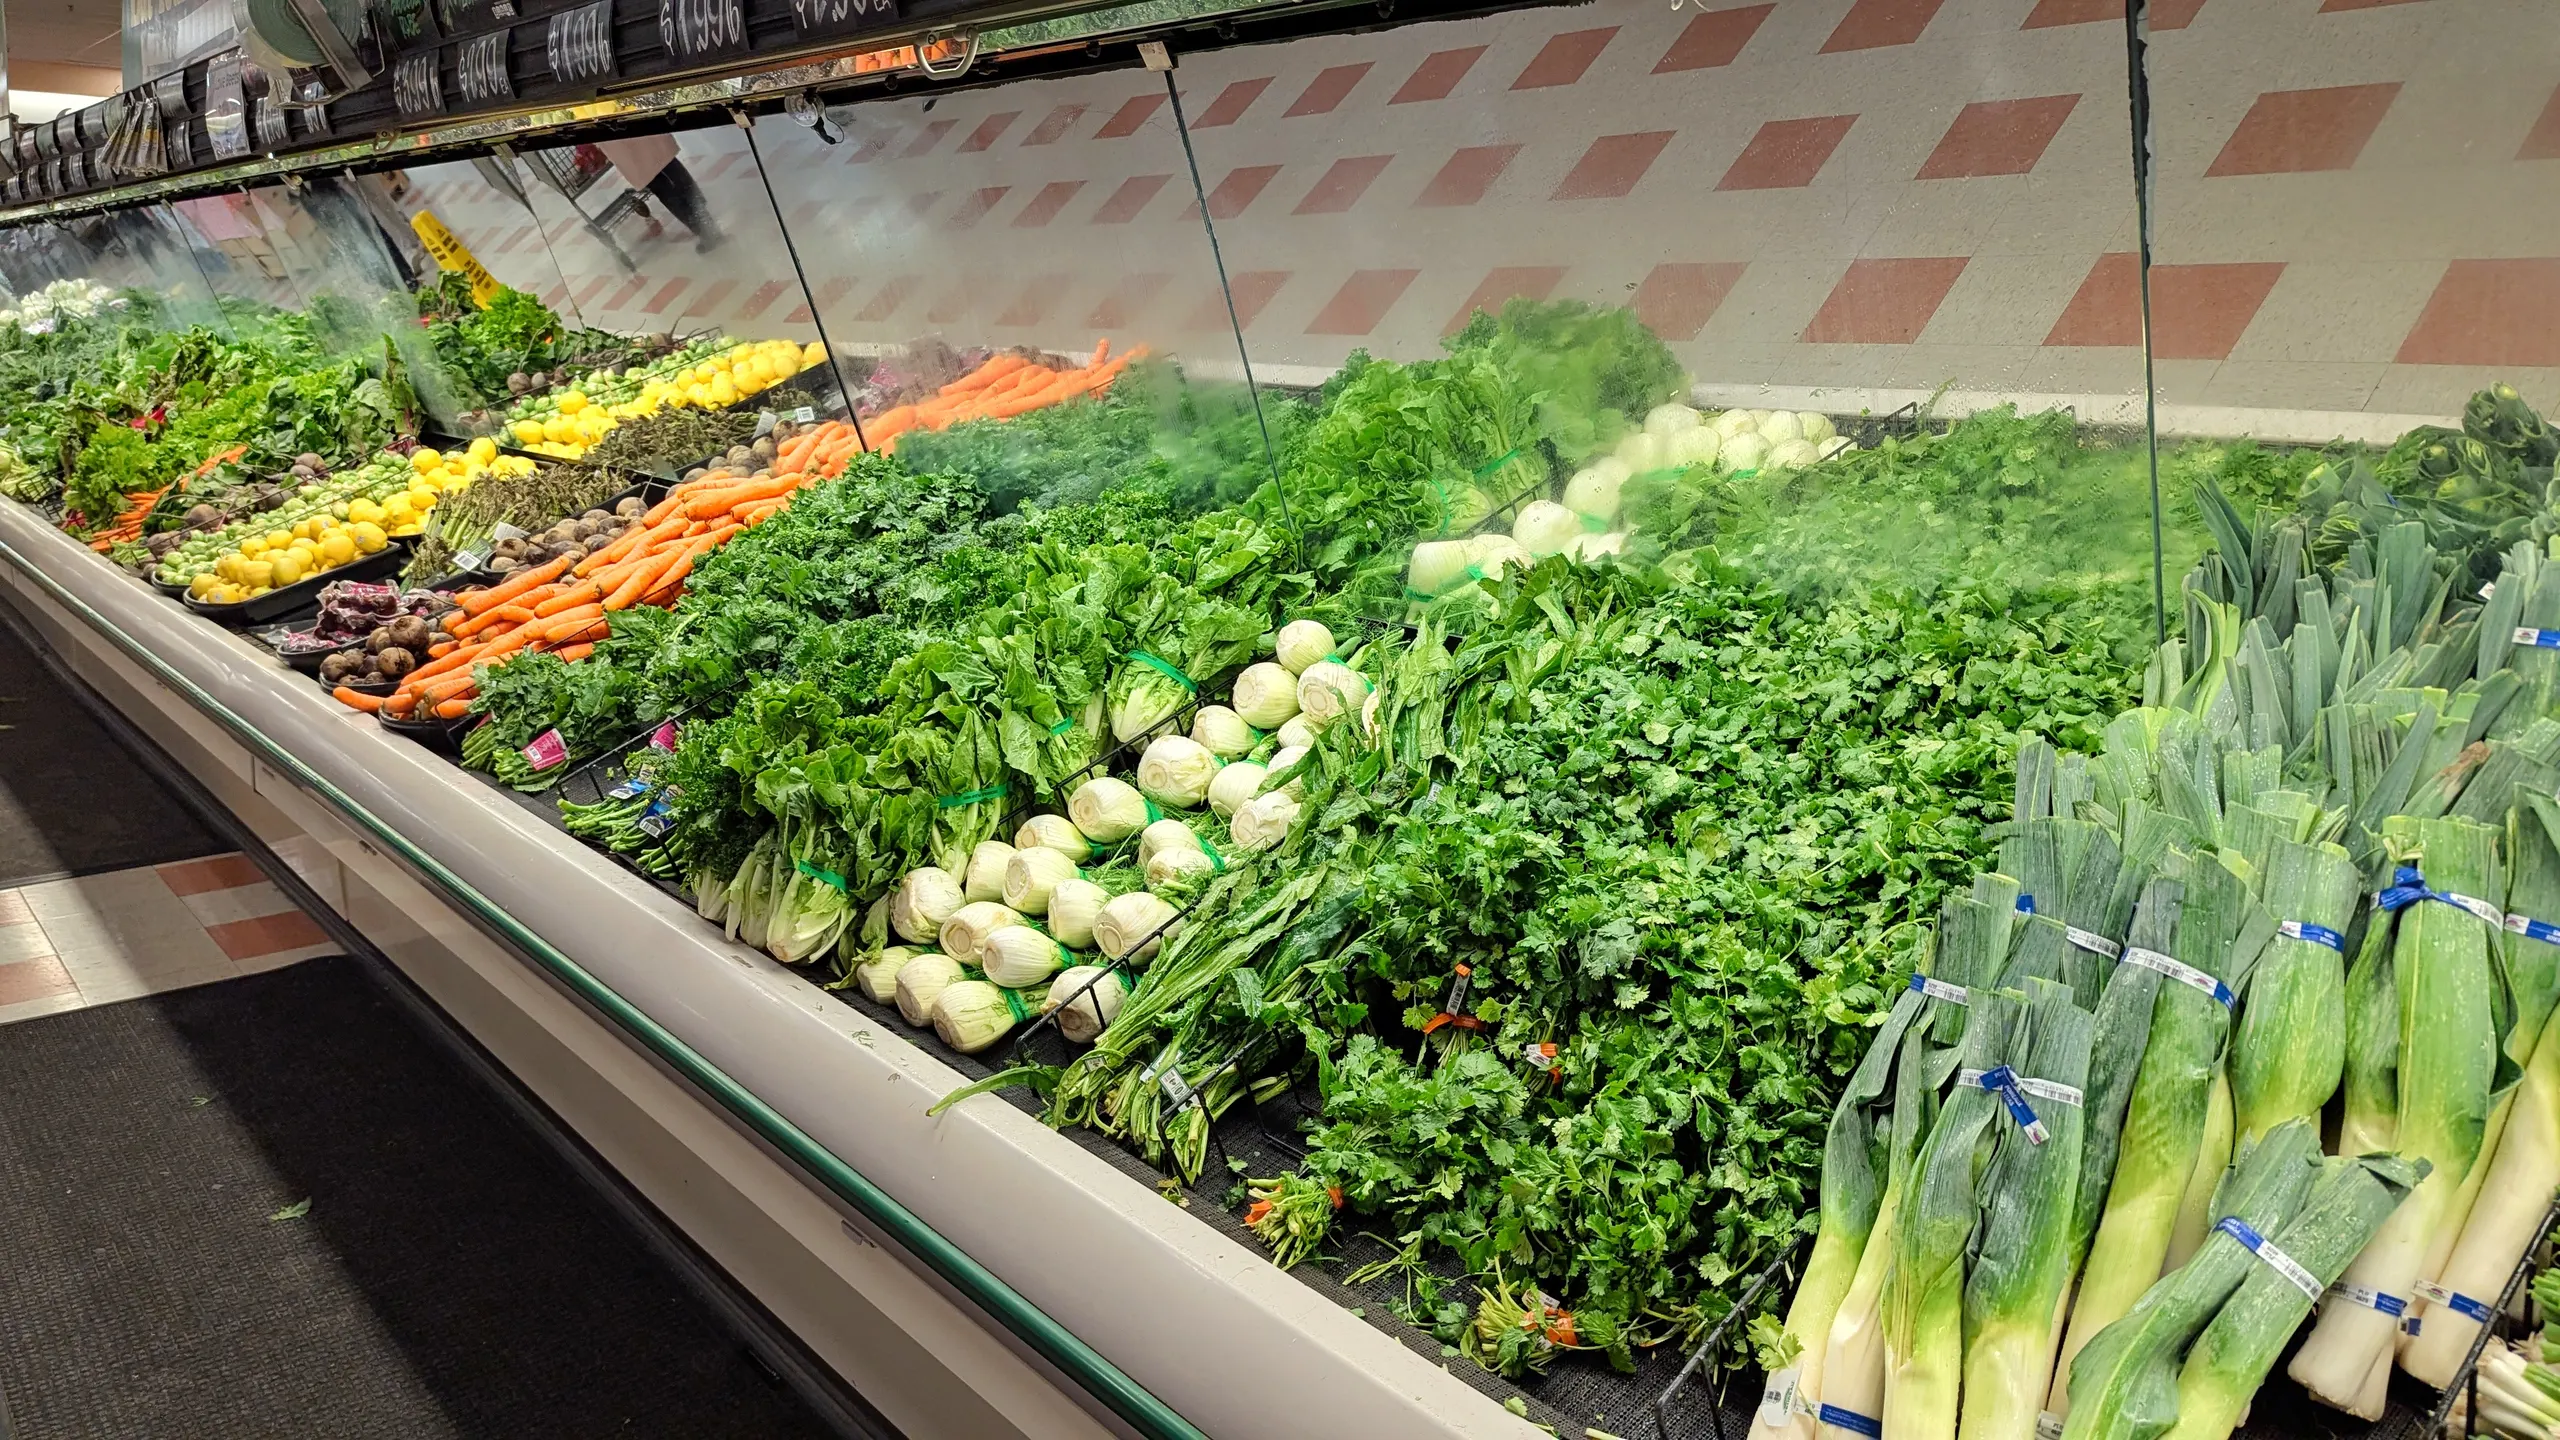
Food shows how the reports can move in the same direction at different speeds. Producer prices for final-demand food rose 1.3%. Grocery prices in the CPI rose 0.4%. The two food categories cover different transactions. A producer may sell to a restaurant or a grocery chain, while the retail figure reflects what households actually paid. A retailer can also draw down existing stock, change promotions or absorb part of a higher supplier price.
The headline annual figures are especially easy to confuse this month. BLS did not collect most CPI data in October 2025 during a lapse in government funding. Without that comparison month, the agency did not publish a headline 12-month CPI change for October 2026. The producer index has a 12-month reading of 6.5%. It measures producer prices and cannot fill the gap in the consumer report.
September’s PPI was initially reported at 1.3% for the month. The October release revised it to 1.4% after later responses and corrections. BLS scheduled the next producer-price release, covering November, for Dec. 15 at 8:30 a.m. Eastern.