

NASA’s new comparison of Pacific Ocean conditions shows a pattern of elevated sea levels resembling the powerful 1997 El Niño. The Earth Observatory report, published October 23, compares satellite observations from October 13, 1997, and October 12, 2026.
What the map measures
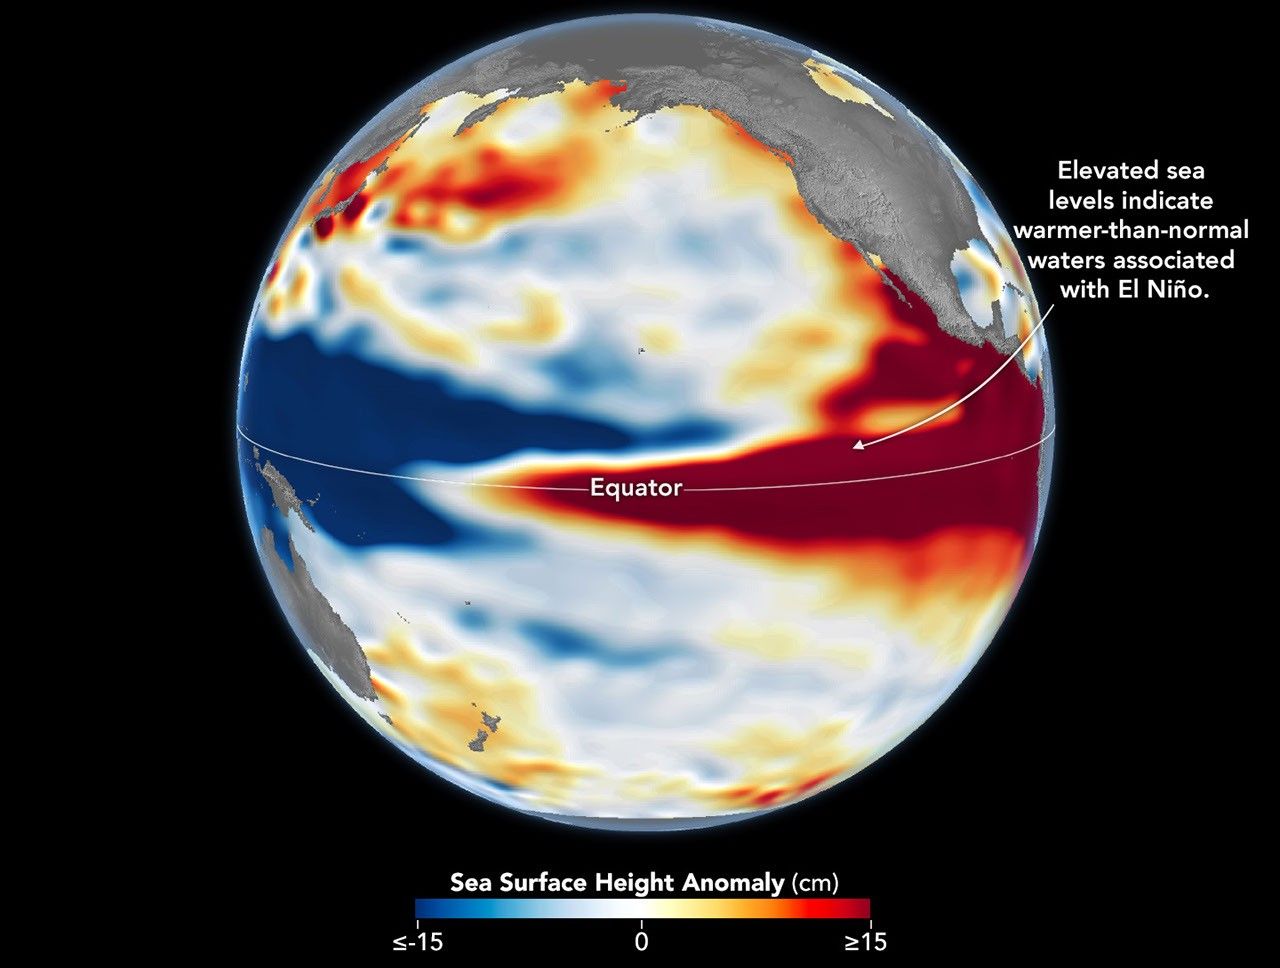
The colors show sea surface height anomalies, measured in centimeters. Warmer water expands, so higher sea levels can reveal heat accumulating in the ocean. These are not direct temperature measurements.
Scientists removed seasonal cycles and long-term trends to make the shorter-term patterns easier to compare. Red shows higher-than-average sea levels, white indicates normal levels and blue shows lower levels.
What NOAA expects for the U.S.
The Climate Prediction Center’s October 8 advisory separately reports a strengthening El Niño, with strong-to-very strong conditions likely through January to March 2027. NOAA also examines ocean temperatures, wind patterns and rainfall.
NOAA’s October 15 seasonal outlook favors above-normal precipitation for November through January across much of California, the Southwest, central and southern Plains, Southeast and Eastern Seaboard. It favors above-normal temperatures across the northern tier, among other regions.
Those are probabilities for a three-month season. They do not specify the timing or severity of an individual storm. Areas marked "equal chances" have similar probabilities of below-normal, near-normal and above-normal conditions; the label does not promise average weather.
NOAA schedules its next ENSO discussion for November 12 and its next seasonal outlook for November 19.